
The Most Dangerous Roads in Contra Costa County
Scranton Law Firm analyzed every fatal traffic crash in Contra Costa County recorded by the federal government from 2019 through 2024. The data shows where deadly crashes happen most often, which roads carry the highest fatality burden, and when local drivers face the greatest risk.
Key Findings
Eight numbers that define six years of fatal crashes in Contra Costa County.
509 people died in 469 fatal crashes on Contra Costa County roads from 2019 through 2024, averaging about 85 traffic deaths per year.
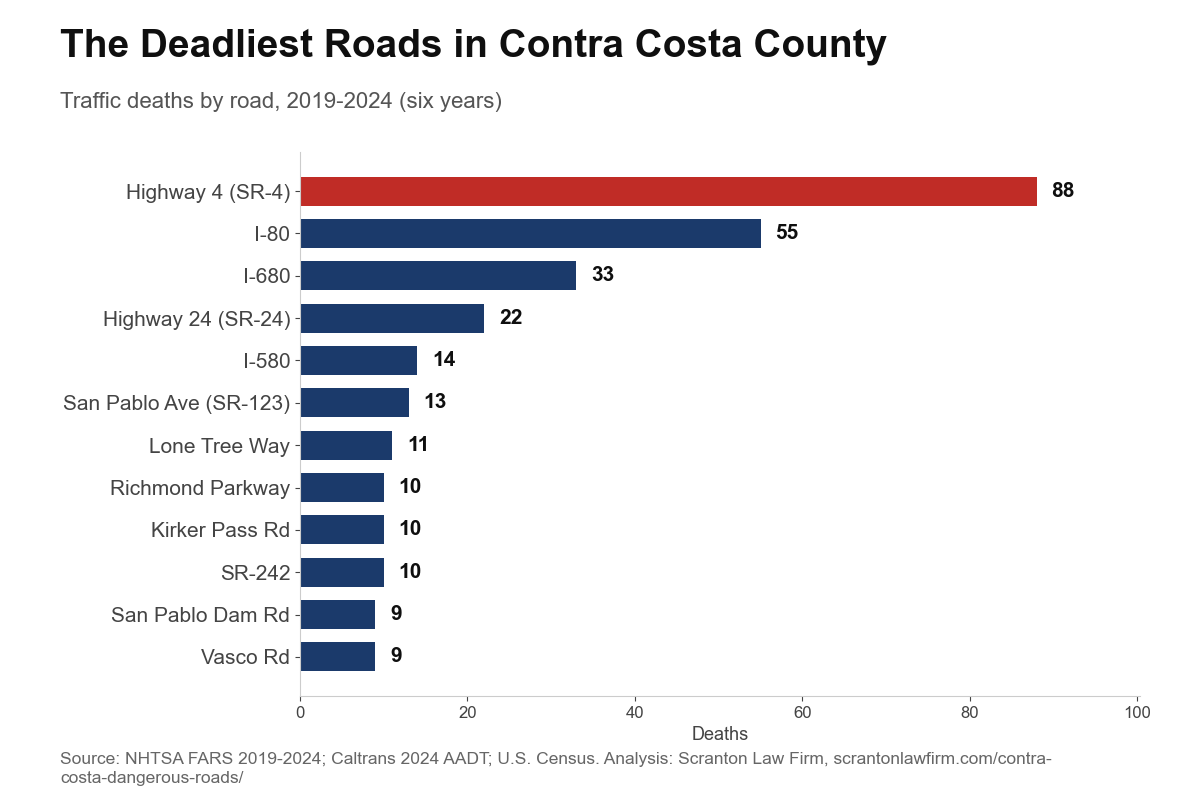
Highway 4 is the county’s deadliest road by far, with 88 deaths in six years. That is more than Interstate 680 and Highway 24 combined.
The Highway 4 corridor through Antioch and Pittsburg had the densest fatal-crash clusters in the county.
50% of fatal crashes happened at night between 8pm and 5am.
52% happened Friday through Sunday, with Saturday, Sunday, and Friday ranking as the deadliest days.
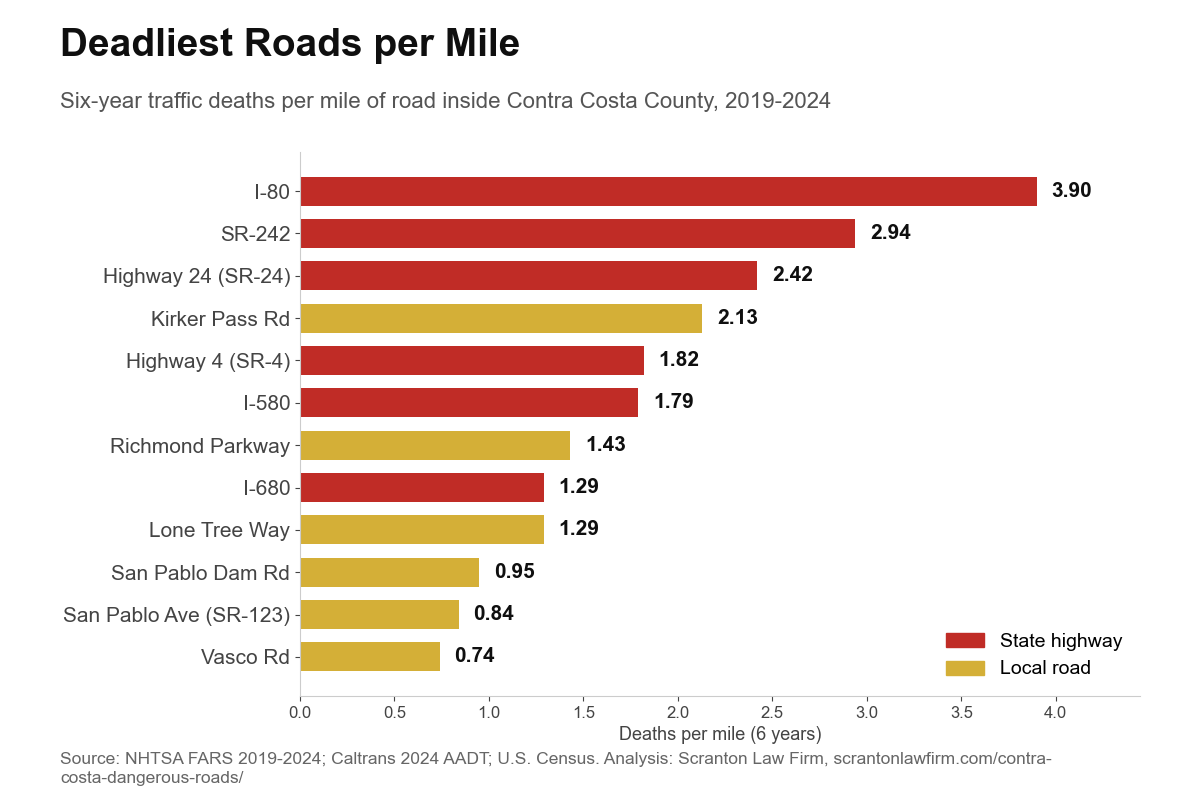
Per mile, I-80 is the deadliest road in the county, with 3.9 deaths per mile over six years, about double Highway 4’s 1.8.
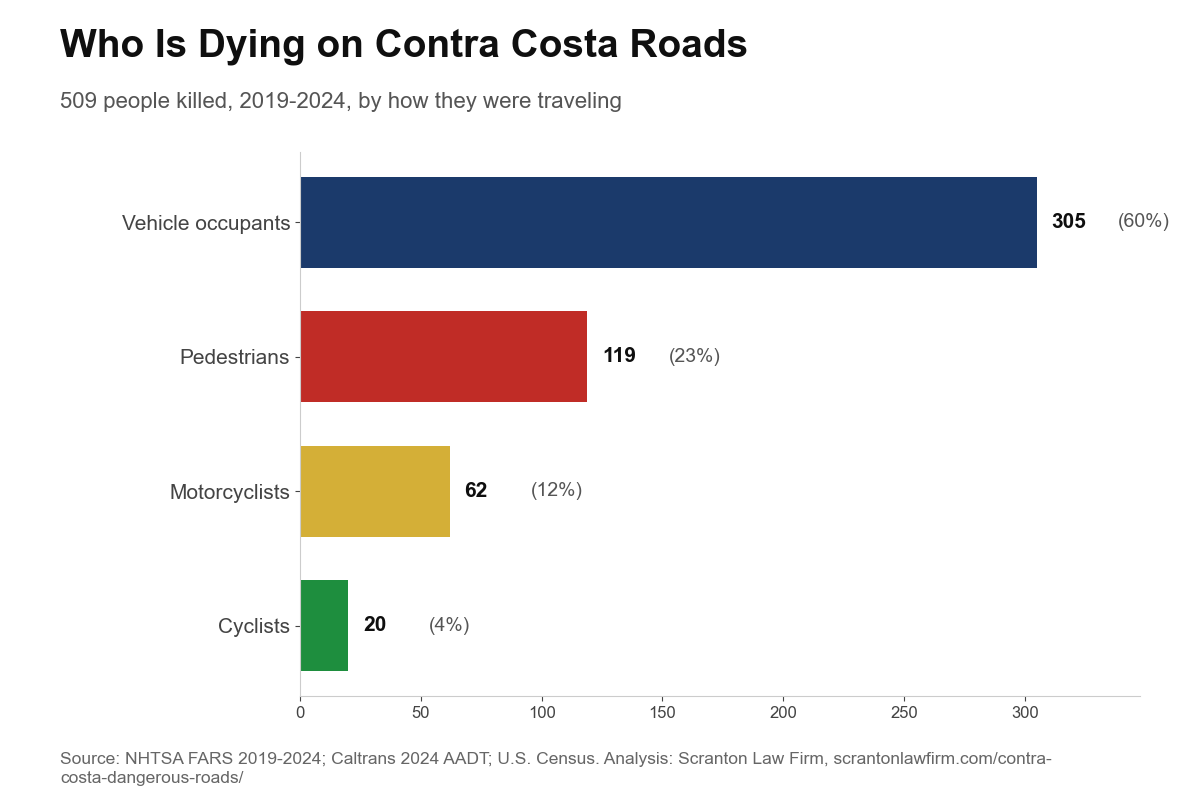
119 pedestrians, 62 motorcyclists, and 20 cyclists were killed, and an estimated 38% of fatal crashes involved a driver at or above the .08 legal limit.
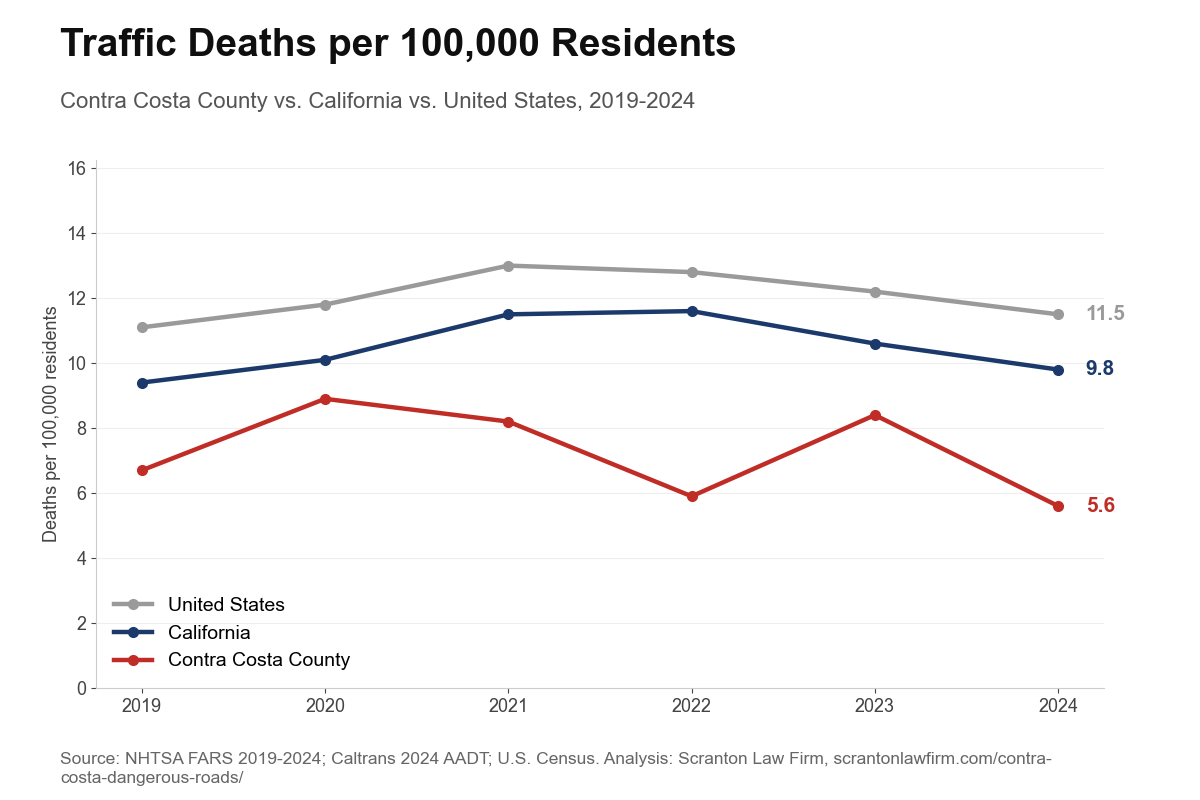
Contra Costa’s death rate is below California’s and the nation’s every year, 5.6 per 100,000 residents in 2024 versus 9.8 statewide and 11.5 nationally. From 2019 to 2024, traffic deaths rose 8% nationally and 4% statewide but fell 14% in Contra Costa.
The Deadliest Roads in Contra Costa County
Ranked by traffic deaths recorded in the NHTSA Fatality Analysis Reporting System, 2019-2024.
Full ranking
| Rank | Road | Fatal Crashes | Deaths | Deaths per Mile | Deaths per 100M Vehicle Miles Driven |
|---|---|---|---|---|---|
| 1 | Highway 4 (SR-4) | 78 | 88 | 1.82 | 1.01 |
| 2 | I-80 | 47 | 55 | 3.90 | 1.08 |
| 3 | I-680 | 29 | 33 | 1.29 | 0.38 |
| 4 | Highway 24 (SR-24) | 18 | 22 | 2.42 | 0.63 |
| 5 | I-580 | 13 | 14 | 1.79 | 0.97 |
| 6 | San Pablo Ave (SR-123) | 13 | 13 | 0.84 | n/a |
| 7 | Lone Tree Way | 8 | 11 | 1.29 | n/a |
| 8 | Richmond Parkway | 10 | 10 | 1.43 | n/a |
| 9 | Kirker Pass Rd | 10 | 10 | 2.13 | n/a |
| 10 | SR-242 | 10 | 10 | 2.94 | 1.18 |
| 11 | San Pablo Dam Rd | 9 | 9 | 0.95 | n/a |
| 12 | Vasco Rd | 8 | 9 | 0.74 | n/a |
Swipe the table sideways to see every column.
Highway 4 recorded 78 fatal crashes and 88 deaths over six years, making it the single deadliest road in Contra Costa County. Fatal crashes concentrate most heavily through East County, especially around Antioch and Pittsburg.
The Deadliest Roads per Mile
Total deaths favor long roads. Dividing by length shows where each mile is most dangerous.

I-80 carries 3.9 deaths per mile, the highest of any road on the list. Highway 4 has the most deaths overall (88) but spreads them over about 48 miles, for 1.8 per mile.

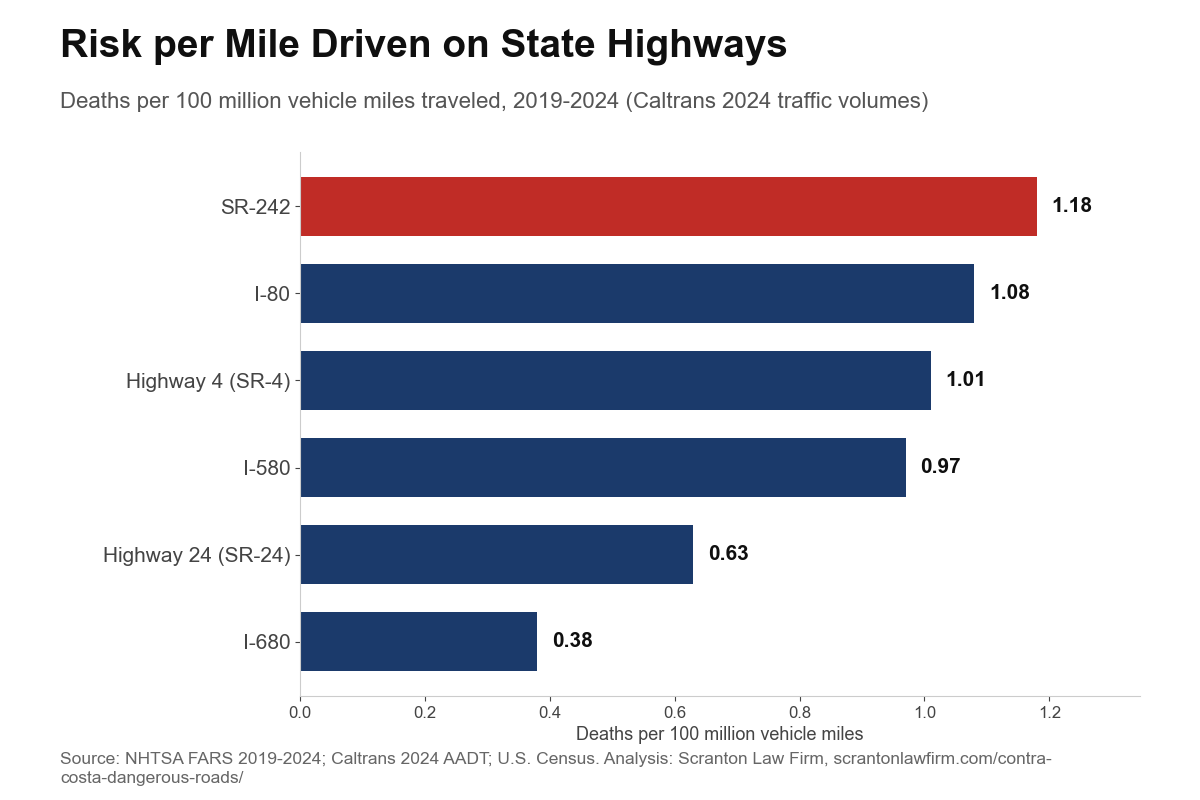
Adjusting for how much traffic each highway carries, SR-242 has the highest risk per mile driven at 1.18 deaths per 100 million vehicle miles. I-680 is the lowest at 0.38.
Dangerous Corridors and Hotspots
The data points to several recurring fatal-crash corridors rather than one isolated intersection.
Highway 4 through Antioch and Pittsburg
The county’s strongest fatal-crash cluster.
Interstate 80 through Richmond
The second-deadliest corridor by traffic deaths.
Richmond surface streets around Barrett Avenue and 23rd Street
One of the top surface-street fatal-crash clusters.
Top fatal-crash coordinate clusters
Fatal crashes per cluster on a 10-crash scale.
Hotspots are approximate coordinate clusters rounded to about 0.01 degrees. They should be read as corridors or areas, not exact intersection counts.
When Contra Costa Roads Turn Deadly
Fatal crashes are not evenly distributed across the week or the clock. Night and weekend patterns stand out sharply.
Fatal crashes by year
| Year | Fatal Crashes | Deaths |
|---|---|---|
| 2019 | 69 | 77 |
| 2020 | 95 | 104 |
| 2021 | 90 | 95 |
| 2022 | 64 | 69 |
| 2023 | 87 | 98 |
| 2024 | 64 | 66 |
2020 was the deadliest year in the period, with 104 deaths.
Deadliest hours
Late-night crashes peak around 1:00 a.m.
Deadliest days
Friday through Sunday account for 52% of fatal crashes.
Deadliest months
A seasonal snapshot of all 469 fatal crashes.
- October5311.3%
- July439.2%
- December439.2%
- February429.0%
- June408.5%
- All other months24852.9%
October leads every other month here, and in California and the U.S. too. Read why in October is the deadliest month on Contra Costa’s roads.
Map: Every Fatal Crash, 2019-2024
All 469 fatal crashes in Contra Costa County. Filter by city, year, or who was killed, and tap a dot for details.
“Unincorporated” means outside city limits as recorded by FARS, including freeway stretches and communities such as Bay Point and Discovery Bay. Locations are the coordinates reported to NHTSA.
Who Is Dying on Contra Costa Roads
509 people were killed from 2019 through 2024. Here is how they were traveling.

Pedestrians are paying a heavy price
Nearly 1 in 4 people killed on Contra Costa roads was walking. Pedestrian deaths often happen on surface arterials where fast traffic mixes with people walking to homes, stores, transit stops, and schools.
Alcohol
Using NHTSA’s own estimation method for untested drivers, about 180 of the county’s 469 fatal crashes (roughly 38%) involved a driver with a blood alcohol concentration of .08 or higher, the legal limit in California. Those crashes killed an estimated 201 people.
Motorcycle riders

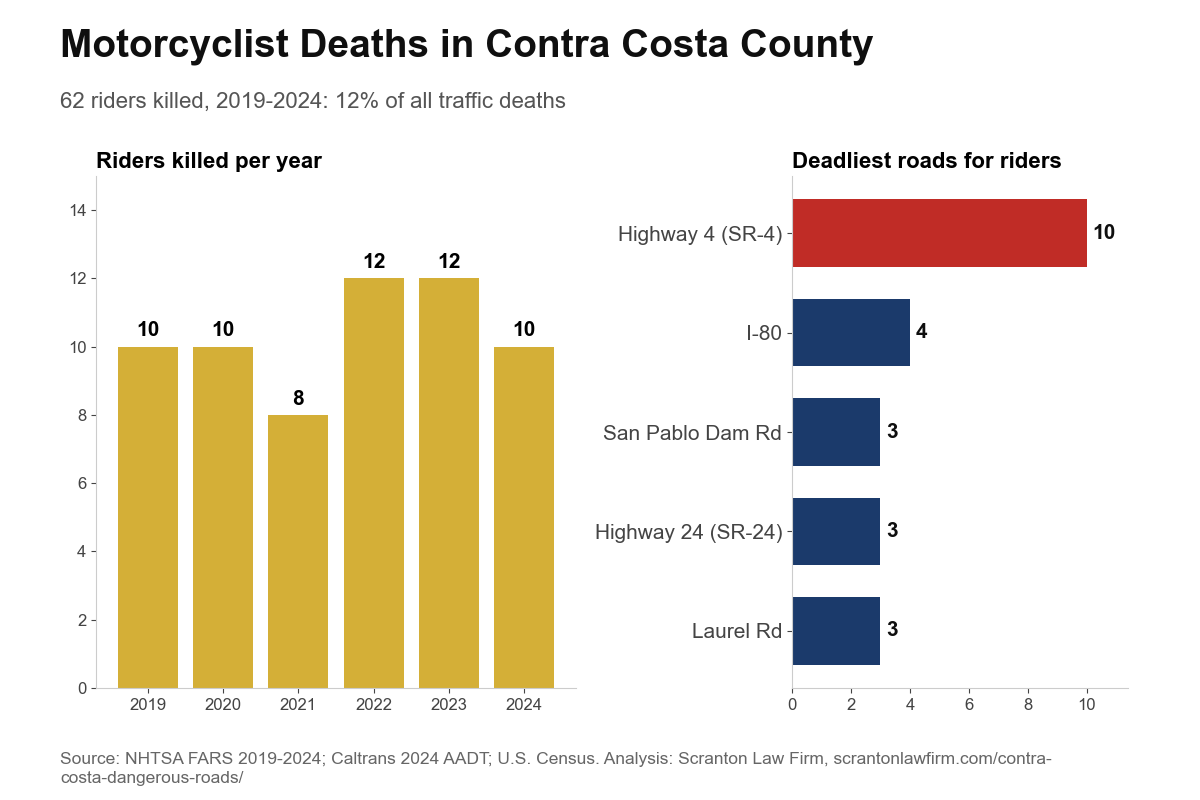
- 62 motorcyclists were killed in six years, 12% of all traffic deaths in the county, a far larger share than motorcycles’ share of traffic.
- Highway 4 is the deadliest road for riders. The top roads for motorcyclist deaths were Highway 4 (SR-4) (10), I-80 (4), San Pablo Dam Rd (3).
- 61% of fatal motorcycle crashes happened Friday through Sunday, and 35% happened between 8pm and 5am.
- 35% involved no other vehicle, which means roughly two out of three fatal motorcycle crashes involved another vehicle.
- The median age of riders killed was 41.
How Contra Costa riders compare
| Area | Riders Killed, 2019-2024 | Share of All Traffic Deaths | Per 100K Residents (yearly avg) | 2019 to 2024 |
|---|---|---|---|---|
| Contra Costa County | 62 | 12.2% | 0.89 | 10 to 10 (unchanged) |
| California | 3,430 | 13.8% | 1.45 | 491 to 522 (up 6%) |
| United States | 35,649 | 14.8% | 1.78 | 5,044 to 6,227 (up 23%) |
Swipe the table sideways to see every column.
Per resident, riders in Contra Costa die at about 61% of California’s rate and about half the national rate. From 2019 to 2024, motorcyclist deaths were up 23% nationally and up 6% in California. Contra Costa held steady, with 10 riders killed in 2019 and 10 in 2024.
But riders have not shared in the county’s progress. Overall traffic deaths in Contra Costa fell from 77 in 2019 to 66 in 2024, while rider deaths stayed at 10. Motorcyclists went from 13% of the county’s traffic deaths in 2019 to 15% in 2024, and reached 17% in 2022. Everyone else on the road got safer. Riders did not.
Scranton Law Firm’s attorneys ride. If you or someone you love was hurt on a motorcycle in Contra Costa County, our Concord motorcycle accident lawyers can help.
How Contra Costa Compares
Traffic deaths per 100,000 residents, Contra Costa County versus California and the United States.

Contra Costa’s traffic death rate was lower than California’s and the nation’s in every year from 2019 through 2024. The county’s worst year was 2020, at 8.9 deaths per 100,000 residents. Its best was 2024, at 5.6.
From 2019 to 2024, U.S. traffic deaths were up 8% (36,355 to 39,254) and California’s were up 4% (3,719 to 3,876). Contra Costa’s were down 14% (77 to 66). Per 100,000 residents, the national rate went from 11.1 to 11.5, California’s from 9.4 to 9.8, and Contra Costa’s from 6.7 to 5.6. County numbers are small and swing from year to year (2020 peaked at 104 deaths), so the six-year pattern matters more than any single year.
| Year | Contra Costa Deaths | Contra Costa per 100K | California per 100K | U.S. per 100K |
|---|---|---|---|---|
| 2019 | 77 | 6.7 | 9.4 | 11.1 |
| 2020 | 104 | 8.9 | 10.1 | 11.8 |
| 2021 | 95 | 8.2 | 11.5 | 13.0 |
| 2022 | 69 | 5.9 | 11.6 | 12.8 |
| 2023 | 98 | 8.4 | 10.6 | 12.2 |
| 2024 | 66 | 5.6 | 9.8 | 11.5 |
Swipe the table sideways to see every column.
Methodology
This report analyzes every fatal traffic crash in Contra Costa County recorded in the National Highway Traffic Safety Administration’s Fatality Analysis Reporting System from 2019 through 2024. FARS is a complete census of fatal motor-vehicle crashes, not a sample. The analysis filters national FARS accident files to California state code 06 and Contra Costa County code 013, then groups crashes by primary roadway name and maps crashes by reported GPS coordinates.
Data for 2019 through 2023 is final. The 2024 data is NHTSA’s most recent release and may revise as late-reported cases are added. This analysis covers fatal crashes only. Total injury crashes may show different risk patterns and would require a separate SWITRS/TIMS injury-crash analysis.
Victim types. Victim type from the FARS person file for people killed (INJ_SEV 4): pedestrians (PER_TYP 5), cyclists (6-7), motorcyclists (drivers/passengers of vehicles with body type 80-89), other vehicle occupants.
Alcohol. Alcohol-involved uses NHTSA’s own multiple-imputation file (MIACC): a crash counts when the highest driver BAC is .08 or above, averaged across NHTSA’s 10 imputations. Figures are estimates.
Deaths per mile. Deaths per mile divide six-year deaths by road length inside Contra Costa. State highway length is the postmile span between Caltrans count locations; local road length is the OpenStreetMap centerline (divided roads counted once). Lengths are approximate.
Deaths per vehicle mile traveled. Deaths per 100 million vehicle miles traveled use Caltrans 2024 AADT (count year Oct-Sep) applied to all six years, so rates are estimates. Local roads have no consistent published traffic volumes, so no VMT rate is shown for them.
Per-capita rates. Deaths per 100,000 residents use U.S. Census Bureau population estimates (Vintage 2020 for 2019, Vintage 2024 for 2020-2024). California and U.S. deaths come from the same FARS files.
Data sources: NHTSA Fatality Analysis Reporting System, 2019-2024; Caltrans Traffic Census Program, 2024 AADT; U.S. Census Bureau population estimates; OpenStreetMap road geometry. Analysis by Scranton Law Firm.
Press Kit: Charts, Data, and Embed Code
Members of the media, public agencies, and researchers may use these charts and figures with attribution under a Creative Commons BY 4.0 license. Every chart has the source and credit built in.
 Deaths by road (PNG)
 Deaths per mile (PNG)
 Deaths per vehicle mile (PNG)
 Who is dying (PNG)
 Rate per 100,000 (PNG)
 Motorcyclist deaths (PNG)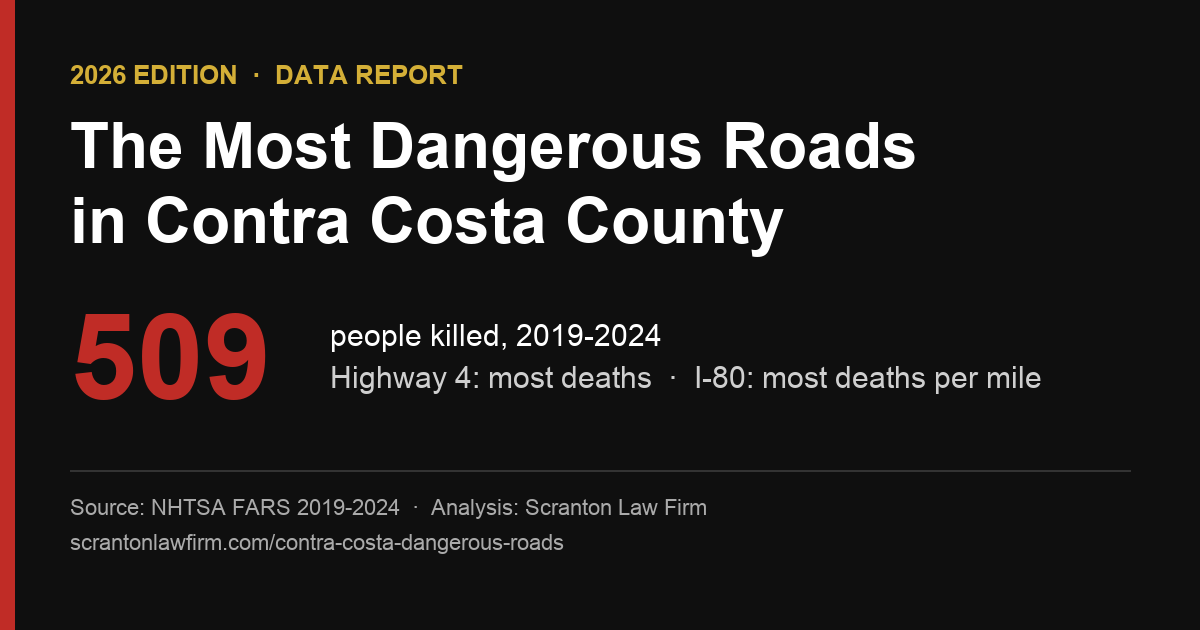
Embed a chart: copy this code into your article or website.
Suggested citation:
Scranton Law Firm. "The Most Dangerous Roads in Contra Costa County: 2026 Data Report" (2026 edition). Analysis of NHTSA FARS data, 2019-2024. https://scrantonlawfirm.com/contra-costa-dangerous-roads/
Christian Scranton, Attorney, Scranton Law Firm
Phone: 800-707-0707 · Send a media request
Edition history
- Updated September 28, 2026: added motorcyclist comparisons with California and the U.S., and the 2019 to 2024 trend for the county, state, and nation.
- 2026 edition, updated September 27, 2026: added deaths per mile and per vehicle mile traveled, victim-type and alcohol breakouts, a motorcycle section, an interactive map of all 469 fatal crashes, per-capita comparisons with California and the U.S., and a press kit. The pedestrian figure now counts people killed while walking (119, 23% of deaths); the first release counted crashes whose first harmful event was a pedestrian (22%).
- First published September 19, 2026: 2019-2024 FARS analysis of deadliest roads, corridors, and timing.
- This report is updated each year at this address when NHTSA releases a new year of FARS data.
Hurt in a Crash on One of These Roads?
Scranton Law Firm has fought for injured Northern Californians for more than 50 years and recovered over $1 billion for clients. The consultation is free, and you pay nothing unless we win.
Local guides for the roads in this study: our Antioch personal injury lawyer page for Highway 4, Lone Tree Way and East County crashes, our Antioch truck accident lawyer page for big rig collisions on Highway 4, and our Concord personal injury lawyer team for crashes on Interstate 680, Highway 242 and central county roads.
Attorney Advertising. Scranton Law Firm, 2450 Stanwell Dr, Concord, CA 94520. Responsible attorney: Christian Scranton, California State Bar #196959. Prior results do not guarantee a similar outcome.