
E-Bike and E-Scooter Crash Data Report: U.S., California and Northern California, 2026 Edition
National ER estimates and death records, California police-reported crashes, county counts, and local hospital findings. Each source measures a different population.
U.S. emergency-room visits
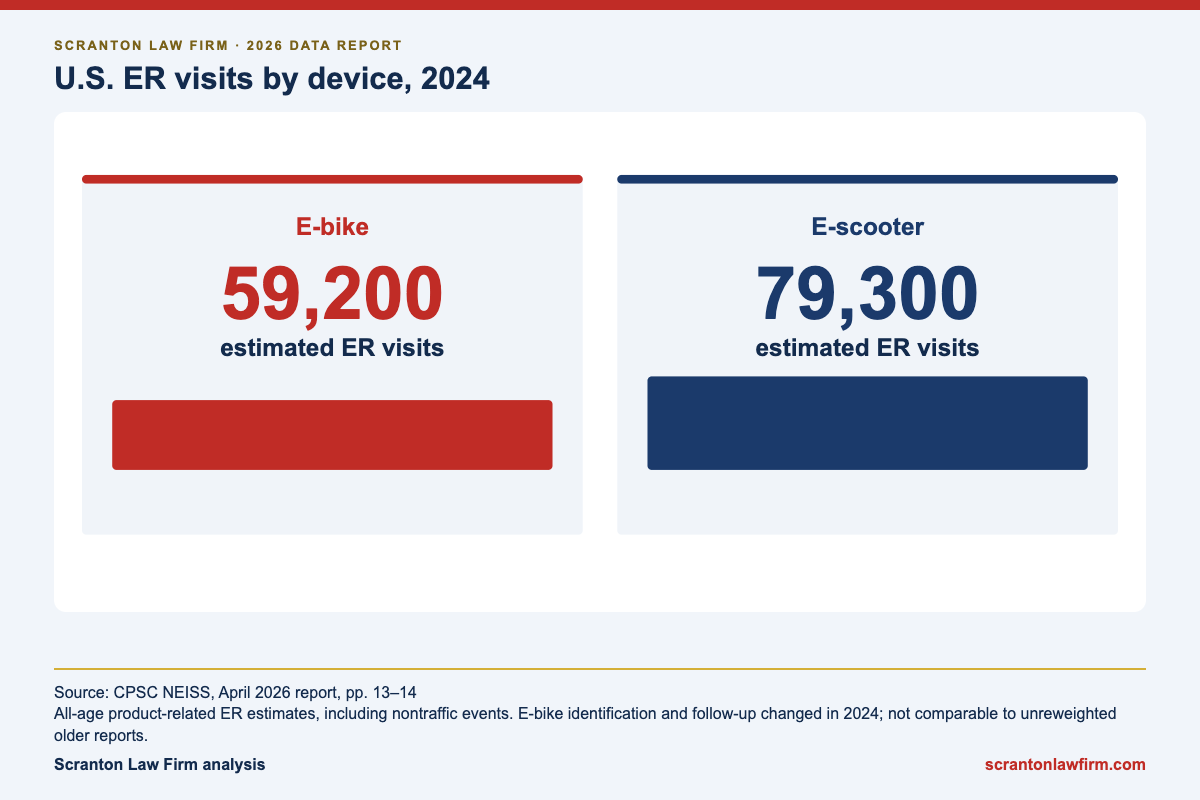
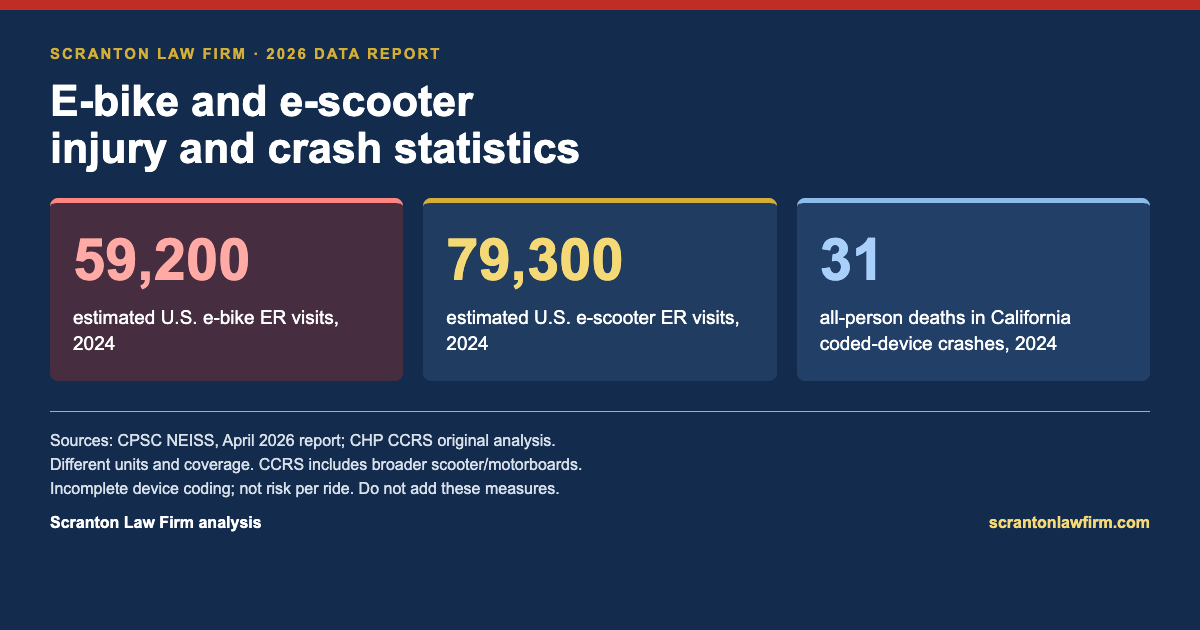
U.S. ER visits by device, 2024
Swipe to see all columns.
| Año | Device | Estimated ER visits |
|---|---|---|
| 2024 | e bike | 59200 |
| 2024 | e scooter | 79300 |
The table shows the verified current-report device estimates. Exact intermediate annual values were not verified, so no device-by-year trend is interpolated; the older annual table is superseded and is not spliced into this chart.
U.S. deaths: FARS and CPSC
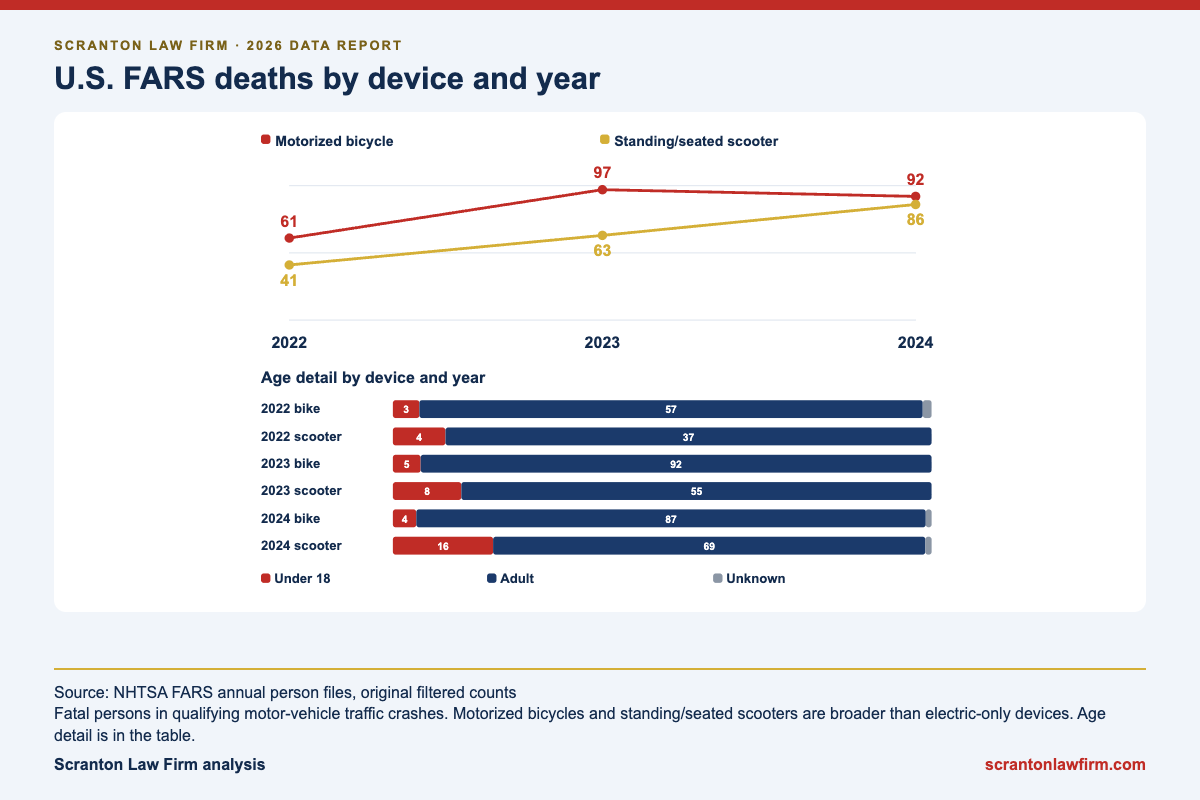
U.S. FARS deaths by device and year
Swipe to see all columns.
| Año | Motorized device | Under 18 | Adult | Unknown age | Total |
|---|---|---|---|---|---|
| 2022 | motorized bicycle | 3 | 57 | 1 | 61 |
| 2022 | motorized standing or seated scooter | 4 | 37 | 0 | 41 |
| 2023 | motorized bicycle | 5 | 92 | 0 | 97 |
| 2023 | motorized standing or seated scooter | 8 | 55 | 0 | 63 |
| 2024 | motorized bicycle | 4 | 87 | 1 | 92 |
| 2024 | motorized standing or seated scooter | 16 | 69 | 1 | 86 |
Comparable device fields begin in 2022, and FARS excludes device-only crashes without a qualifying motor vehicle in transport. Separately, CPSC recorded 533 reported micromobility fatalities in 2017–2024, including 310 e-bike, 206 e-scooter and 17 hoverboard deaths; 135 were reported for 2024.
CPSC reports are incomplete and include fires and nontraffic hazards; neither death system is a complete e-bike/e-scooter death census, and the systems must not be added together.
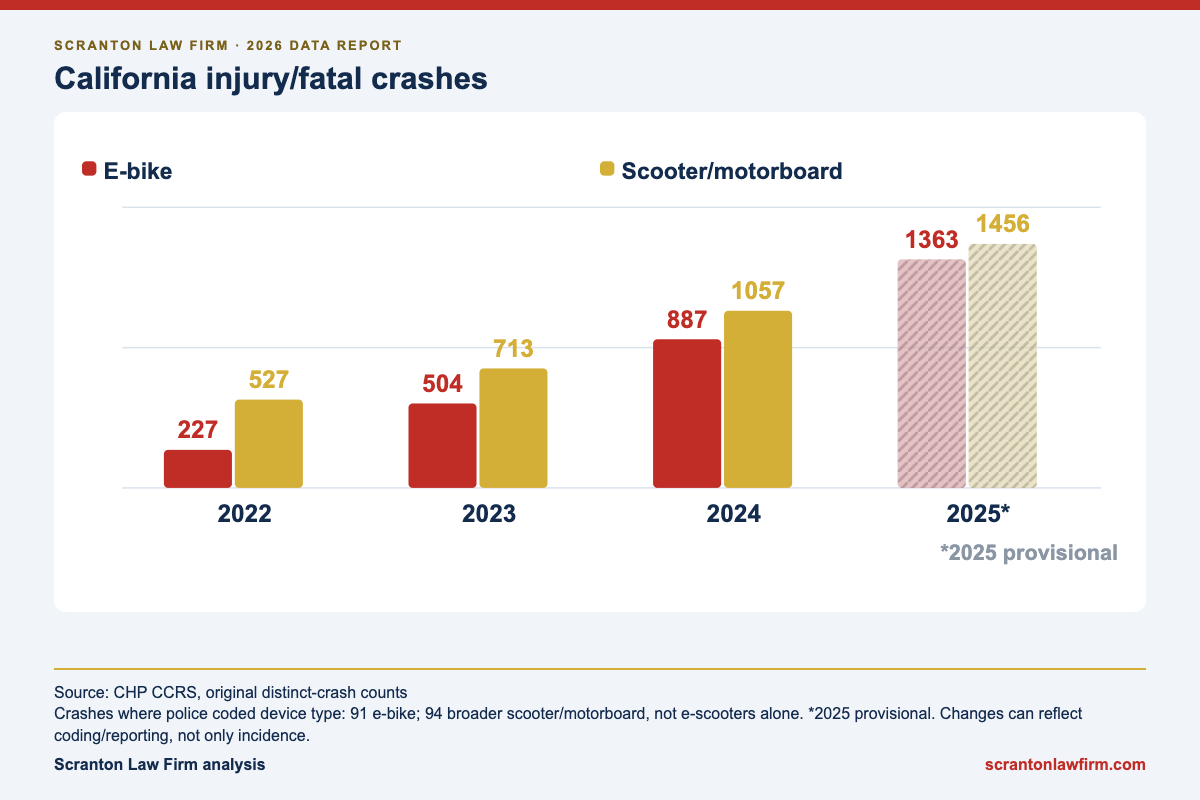
California injury and fatal crashes by year
California injury/fatal crashes
Swipe to see all columns.
| Año | E-bike coded | Scooter/motorboard coded | Combined, deduplicated |
|---|---|---|---|
| 2022 | 227 | 527 | 753 |
| 2023 | 504 | 713 | 1217 |
| 2024 | 887 | 1057 | 1944 |
| 2025 provisional | 1363 | 1456 | 2816 |
The device columns can overlap and must not be added; the combined column deduplicates crash IDs. These mutable police records omit unreported or miscoded events, and provisional 2025 is not a validated incidence trend.
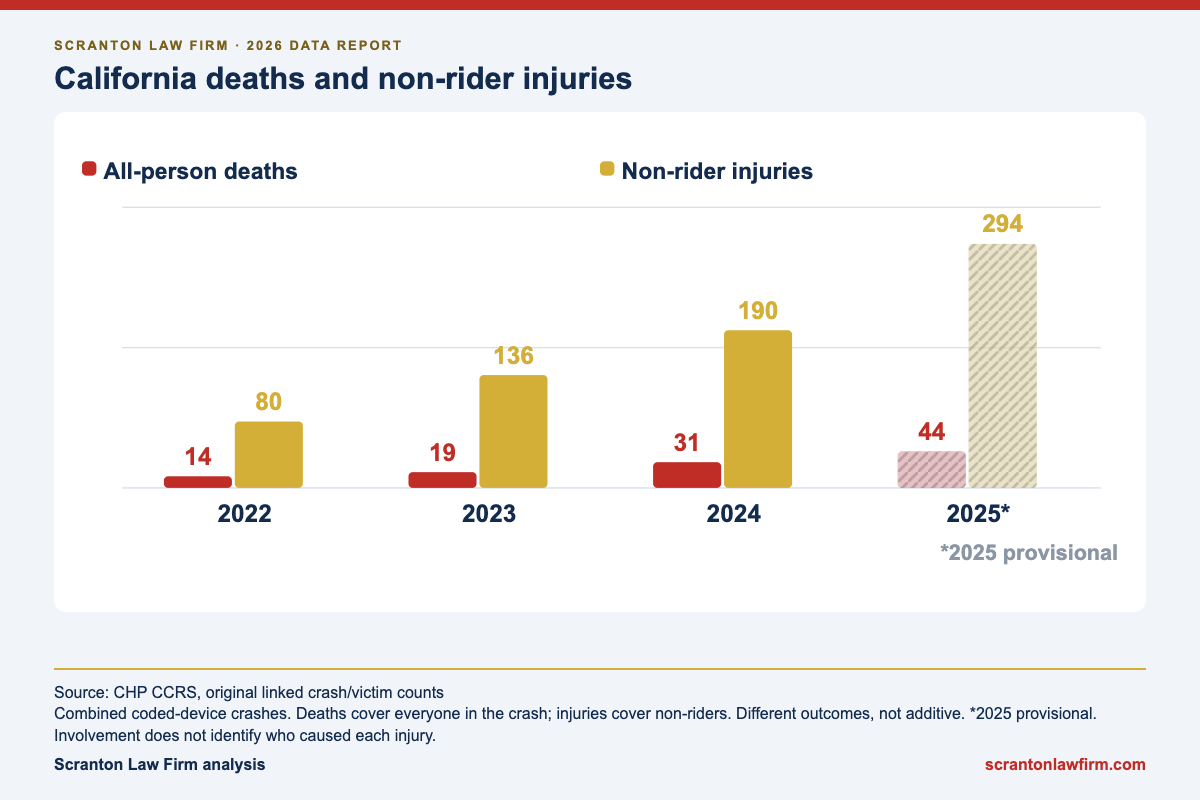
California deaths and non-rider victims
California deaths and non-rider injuries
Swipe to see all columns.
| Año | All deaths | Non-rider deaths | Non-rider injuries | Serious subset | Pedestrian deaths | Pedestrian injuries | Serious subset |
|---|---|---|---|---|---|---|---|
| 2022 | 14 | 0 | 80 | 8 | 0 | 20 | 2 |
| 2023 | 19 | 2 | 136 | 20 | 1 | 38 | 9 |
| 2024 | 31 | 3 | 190 | 27 | 2 | 44 | 9 |
| 2025 provisional | 44 | 3 | 294 | 34 | 1 | 65 | 9 |
Non-riders exclude focal device operators but include other parties and explicitly identified device passengers. Deaths are summed once per crash, victims are deduplicated, and reported serious injury is a police category rather than a clinical audit.
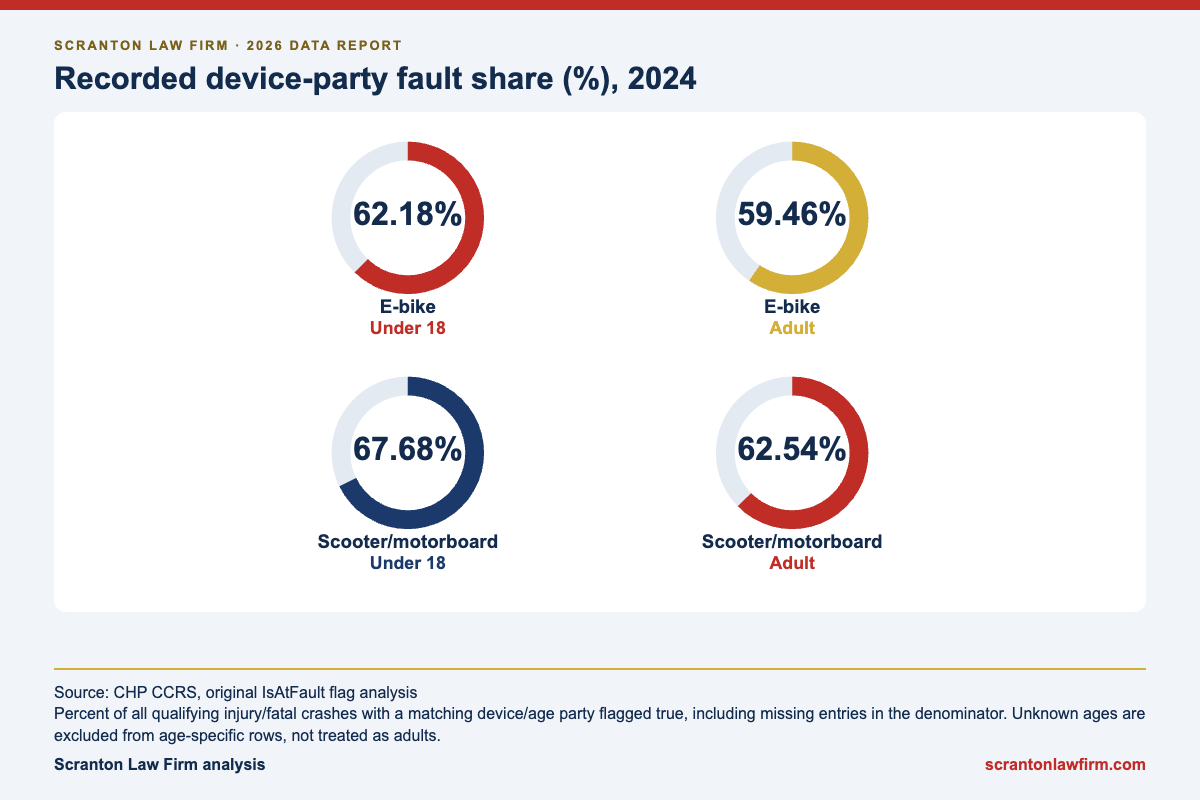
Recorded fault by device and age presence
Recorded device-party fault share (%), 2024
Swipe to see all columns.
| Año | Device | Age presence | Flagged crashes | All qualifying crashes | Flagged share (%) |
|---|---|---|---|---|---|
| 2022 | E-bike | under18 | 43 | 63 | 68.25 |
| 2022 | E-bike | adult | 59 | 113 | 52.21 |
| 2022 | Scooter/motorboard | under18 | 31 | 44 | 70.45 |
| 2022 | Scooter/motorboard | adult | 78 | 118 | 66.1 |
| 2023 | E-bike | under18 | 106 | 166 | 63.86 |
| 2023 | E-bike | adult | 129 | 191 | 67.54 |
| 2023 | Scooter/motorboard | under18 | 33 | 49 | 67.35 |
| 2023 | Scooter/motorboard | adult | 108 | 167 | 64.67 |
| 2024 | E-bike | under18 | 148 | 238 | 62.18 |
| 2024 | E-bike | adult | 198 | 333 | 59.46 |
| 2024 | Scooter/motorboard | under18 | 67 | 99 | 67.68 |
| 2024 | Scooter/motorboard | adult | 197 | 315 | 62.54 |
| 2025 provisional | E-bike | under18 | 264 | 412 | 64.08 |
| 2025 provisional | E-bike | adult | 344 | 590 | 58.31 |
| 2025 provisional | Scooter/motorboard | under18 | 168 | 238 | 70.59 |
| 2025 provisional | Scooter/motorboard | adult | 296 | 540 | 54.81 |
Missing fault entries do not mean false, and age-presence groups can overlap. These are police investigative flags, not proof that a device operator caused every injury; unknown ages and incomplete coding prevent youth-versus-adult risk conclusions.
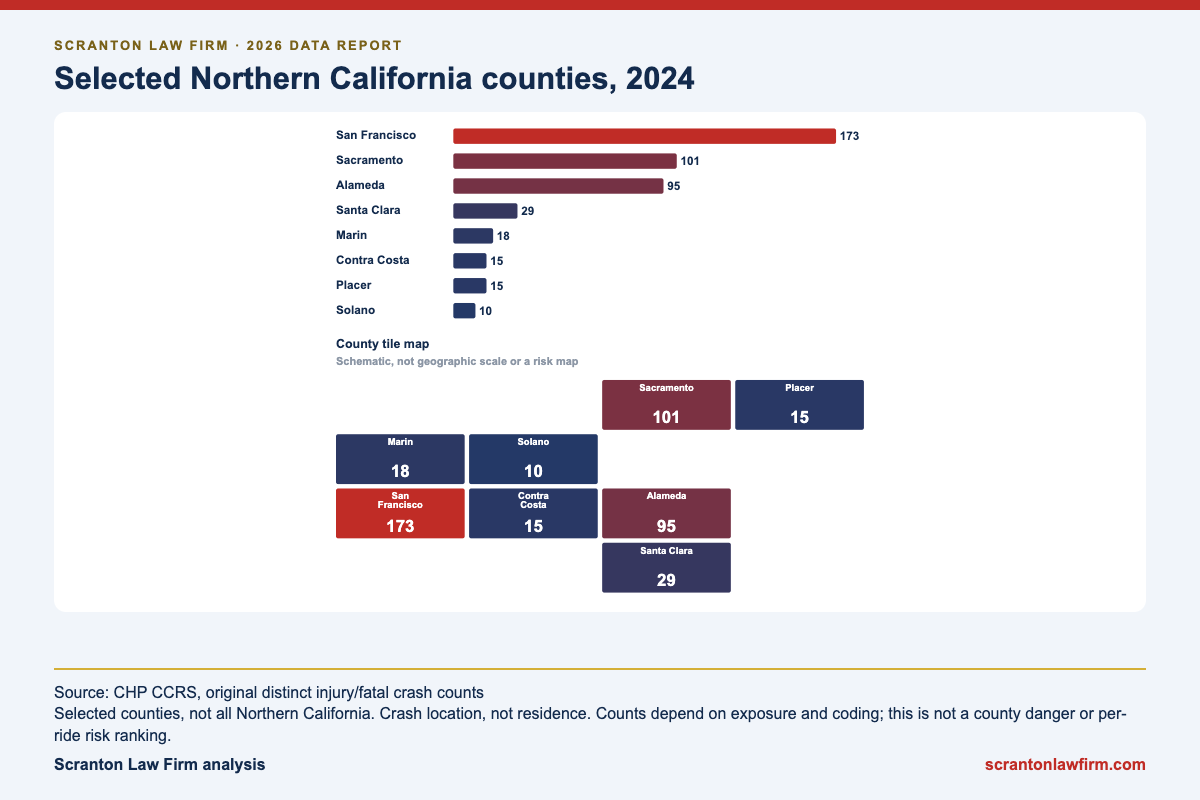
Northern California county count ranking
Selected Northern California counties, 2024
Swipe to see all columns.
| San Francisco | 173 | 1 | 0 | 25 | 0 | 10 | 0 |
|---|---|---|---|---|---|---|---|
| Sacramento | 101 | 4 | 0 | 6 | 0 | 0 | 34 |
| Alameda | 95 | 0 | 0 | 11 | 0 | 1 | 0 |
| Santa Clara | 29 | 1 | 0 | 6 | 0 | 2 | 2 |
| Marin | 18 | 0 | 0 | 2 | 0 | 0 | 4 |
| Contra Costa | 15 | 0 | 0 | 1 | 0 | 0 | 1 |
| Placer | 15 | 0 | 0 | 1 | 0 | 0 | 4 |
| Solano | 10 | 1 | 0 | 2 | 0 | 0 | 1 |
The default order is recorded injury/fatal crash count, not safety. Under-18 involvement means a coded party with a stated minor age, not necessarily an injured child; a zero means no record in this extract, not no real-world harm.
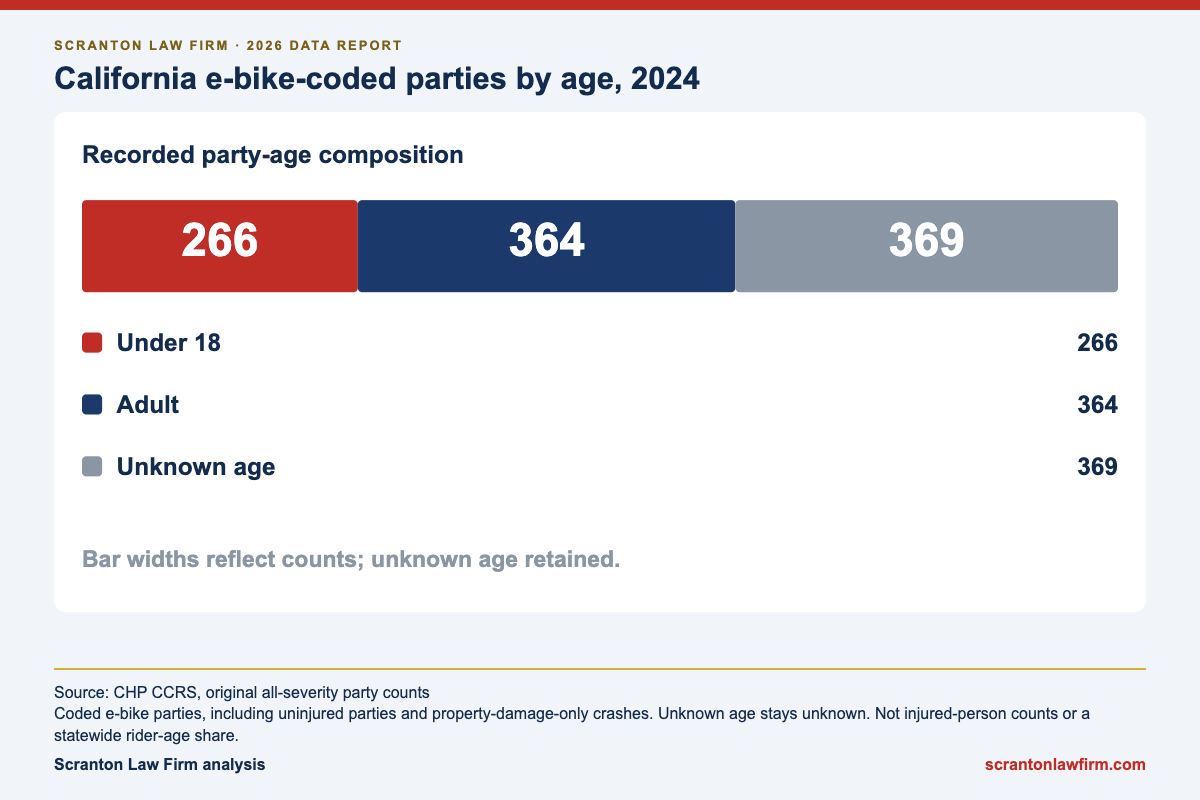
California age breakdown and missingness
California e-bike-coded parties by age, 2024
Swipe to see all columns.
| Año | Under 18 | Adult | Unknown age | Total |
|---|---|---|---|---|
| 2020 | 0 | 10 | 36 | 46 |
| 2021 | 8 | 22 | 49 | 79 |
| 2022 | 67 | 125 | 57 | 249 |
| 2023 | 184 | 211 | 164 | 559 |
| 2024 | 266 | 364 | 369 | 999 |
Under-18 parties account for 266 of 999 recorded parties in 2024, with 369 ages unknown. This fraction is not the percentage of California e-bike riders who are minors; coding adoption, missing age and source coverage prevent a defensible statewide youth share.
Local and clinical data
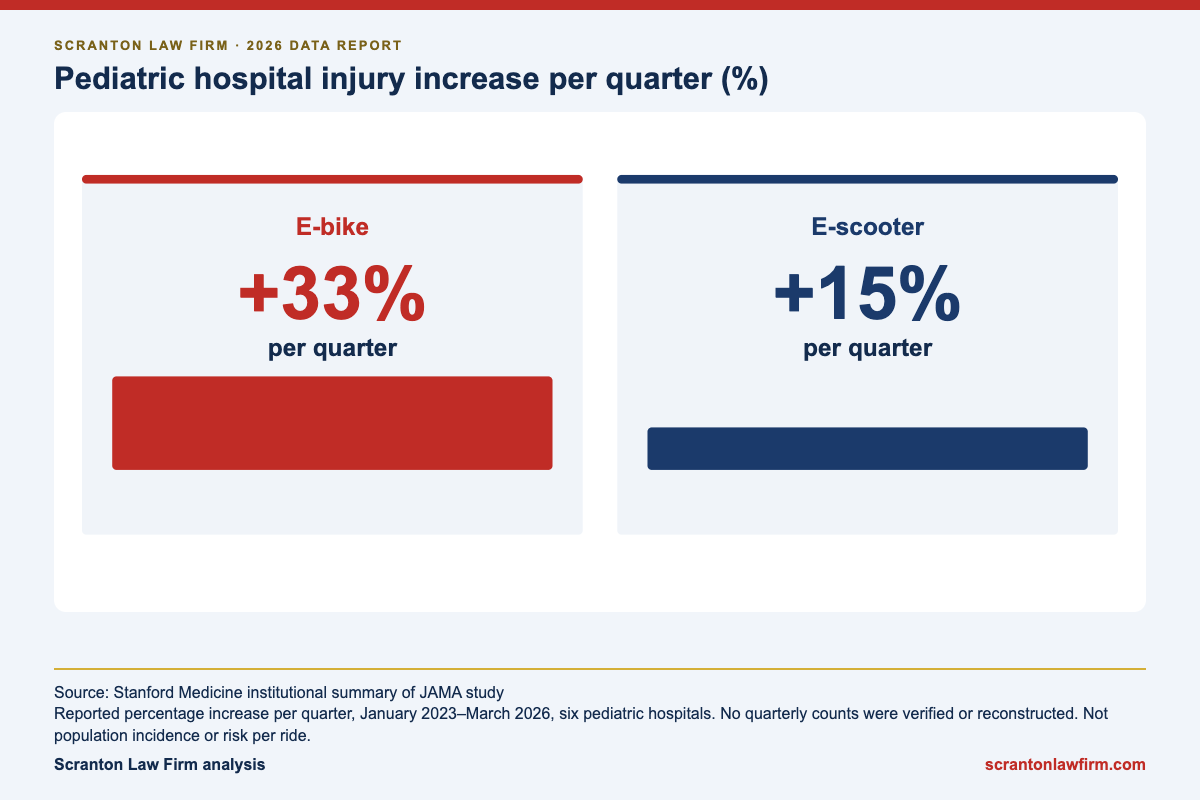
Pediatric hospital injury increase per quarter (%)
Swipe to see all columns.
| Pediatric cohort finding | E-bike | E-scooter |
|---|---|---|
| Reported increase per quarter | 33% | 15% |
| High-severity injuries | 8% | 5% |
| Lesiones cerebrales | 10% | 9% |
The study included 13,307 patients across electric and nonmotorized bicycle, scooter and skateboard comparison groups, not only e-bike/e-scooter injuries. Journal full text was inaccessible, so these findings are attributed to the institutional summary, not independently reconstructed quarterly data.
San Francisco hospital and police series
Swipe to see all columns.
| Año | Severe e-scooter injuries | Critical subset |
|---|---|---|
| 2018 | 7 | 2 |
| 2019 | 4 | 1 |
| 2020 | 5 | 4 |
| 2021 | 8 | 4 |
| 2022 | 8 | 3 |
Swipe to see all columns.
| Año | Powered standing-device injury collisions |
|---|---|
| 2020 | 95 |
| 2023 | 202 |
| 2024 | 227 |
These local series use different devices, outcomes and coverage from the pediatric cohort and CCRS extract; they must not be added together. The police report’s inconsistent fatality prose/table is not used here.
Methodology and limits
National injury estimates. CPSC survey estimates count ER visits, not crashes or unique riders. They cover all ages and product hazards, including nontraffic events. We use the current report’s verified values only. No old-to-new series splice, missing-point interpolation or under-age share reconstructed from incompatible age bands is used.
California selection and deduplication. We select collision IDs with a device party coded 91 o 94, then retrieve crash rows, all parties and injury/passenger records. Deleted crashes and witness-only records are excluded. Deaths are summed once per distinct crash, not multiplied by joined parties. Victims are linked to their own party using collision ID and party number, and explicit fatal or injury severities are required. Combined-device counts deduplicate crashes and victims. Separate device and age-presence cells can overlap and must not be added.
Severity and role. Non-riders exclude the focal device operators but include explicitly identified device passengers. Missing links and unresolved device roles are not automatically classified as other-road-user harm. Serious injury uses the recorded SuspectSerious or legacy SevereInactive codes. It is a subset of injury, not an extra count. Crash-level death sums match fatal victim records in the extraction audit.
Fault. The IsAtFault true numerator is distinct injury/fatal crashes with a matching device/age party flagged true. The denominator is every qualifying injury/fatal crash, including missing flags. A separate primary-collision-party linkage is preserved. Neither measure establishes which party directly injured a victim.
Coverage gaps. 2025 is provisional. All CCRS figures are mutable snapshot counts, not a complete census or per-trip risk. Coding adoption and completeness have not been independently validated. No highway-only filter was applied; some nontraffic reports may appear. Falls, sidewalk/trail events, private-property events and unreported or miscoded crashes may be missed. Unknown age remains unknown. County is crash location.
Different death systems. FARS requires a qualifying motor vehicle in transport and a qualifying death within 30 days. A device/pedestrian-only collision without a qualifying motor vehicle falls outside that system. CCRS can contain device/pedestrian-only reports, but that does not establish complete capture. CPSC fatalities include different hazards. Do not add these systems together.
What cannot be concluded. No complete California or Northern California injury census, validated statewide youth share, risk per ride, or county danger ranking was established. Hospital findings are not added to police counts.
Sources and data definitions
- FARS 2022 National CSV source archive
- FARS 2023 National CSV source archive
- FARS 2024 National CSV source archive
- CPSC current reweighted micromobility injury and reported fatality estimates
- NHTSA FARS annual National CSV person files, original device/age death counts
- FARS Analytical Manual: device definitions and classification break
- CHP CCRS: annual crash, party and injured/witness/passenger records
- Stanford Medicine institutional summary of pediatric JAMA study
- JAMA study DOI, full text not independently accessed
- SFDPH severe injury report, hospital e-scooter series
- SFMTA/SFPD collision report, powered standing-device series
ER visits, fatal persons, injury/fatal crashes, crash-involved parties and hospital encounters are different units. Original source queries and record-linkage evidence remain in the research audit package; downloadable chart CSVs retain source identifiers, with coverage stated in captions and the README.
Citation and press kit
Kit de prensa: gráficos, datos y código de inserción
Members of the media, public agencies, and researchers may use these charts and original analysis with attribution under a Creative Commons BY 4.0 license. Source and Scranton Law Firm analysis credits are built into every image. Underlying publications retain their source-specific terms.
 U.S. ER visits by device, 2024 (PNG)
 U.S. FARS deaths by device and year (PNG)
 California injury/fatal crashes (PNG)
 California deaths and non-rider injuries (PNG)
 Recorded device-party fault share (%), 2024 (PNG)
 Selected Northern California counties, 2024 (PNG)
 California e-bike-coded parties by age, 2024 (PNG)
 Pediatric hospital injury increase per quarter (%) (PNG)
Insertar una gráfica: copy the code below to credit and link to this report.
Cita sugerida:
Scranton Law Firm. "E-Bike and E-Scooter Crash Data Report: U.S., California and Northern California, 2026 Edition". Research snapshot November 4, 2026. https://scrantonlawfirm.com/ebike-escooter-crash-study/Christian Scranton, abogado, Scranton Law Firm
Teléfono: 800-707-0707 · Enviar una solicitud de medios
Historial de ediciones
- November 4, 2026: first edition published.
About this report
Questions about the data or methodology? Contactar a Scranton Law Firm.
Attorney Advertising. Scranton Law Firm. Responsible attorney: Christian Scranton, California State Bar #196959.